This article will show you how to build a Pie Chart using the HTML5 canvas

Final Result

See the Pen Pie Chart Canvas HTML5 by Jonathan klughertz (@klugjo) on CodePen.

Project Description

This mini project / tutorial will give you an introduction on how to draw shapes in the canvas.

HTML

In our HTML file, we will simply insert a <canvas> element and specify a width and height.

<canvas id="canvas" width="600" height="600"></canvas>

Draw a pie slice

Let’s start by drawing a single Pie slice.

Canvas initialization

Let’s create a draw() function that will be executed on a window.onload. We can then retrieve our canvas by it’s id and create our context. The context objet is what will be used to draw our lines.

function draw() {
var canvas = document.getElementById("canvas");
var ctx = canvas.getContext("2d");

// code goes here
}

window.onload = draw;

Draw a Pie Slice

To draw a Pie slice, we will:

  • Move to the (200, 200) coordinates
  • Start drawing an Arc with 120 radius and the center at (200, 200) and an angle of 0.3 PI
  • Continue tracing a line all the way back to the center

Here is the code

function draw() {
var canvas = document.getElementById("canvas");
var ctx = canvas.getContext("2d");

// Our angle
var angle = Math.PI * 0.3;

// Start a new path
ctx.beginPath();

// Go to center of the Chart
ctx.moveTo(200, 200);

// Draw an Arc
// arc(centerX, centerY, radius, angleStart, angleEnd)
ctx.arc(200, 200, 120, 0, angle);

// Draw a line to close the pie slice
ctx.lineTo(200, 200);

// Print the path
ctx.stroke();
}

You might have realised that the initial line is drawn automatically: when we start drawing the arc, the path will automatically be linked from the initial position.

Here is what we have so far:
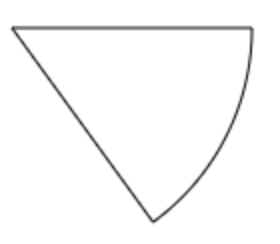
Draw the entire Pie

We will start with an array of angles which sum equals 2 PI and draw the all the slices.

We will also add a list of colours and for each slice, pick one and fill the slice with that color.

function draw() {
var canvas = document.getElementById("canvas");
var ctx = canvas.getContext("2d");

// Colors
var colors = ['#4CAF50', '#00BCD4', '#E91E63', '#FFC107', '#9E9E9E', '#CDDC39'];

// List of Angles
var angles = [Math.PI * 0.3, Math.PI * 0.7, Math.PI * 0.2, Math.PI * 0.4, Math.PI * 0.4];

// Temporary variables, to store each arc angles
var beginAngle = 0;
var endAngle = 0;

// Iterate through the angles
for(var i = 0; i < angles.length; i = i + 1) {
// Begin where we left off
beginAngle = endAngle;
// End Angle
endAngle = endAngle + angles[i];

ctx.beginPath();
// Fill color
ctx.fillStyle = colors[i % colors.length];

// Same code as before
ctx.moveTo(200, 200);
ctx.arc(200, 200, 120, beginAngle, endAngle);
ctx.lineTo(200, 200);
ctx.stroke();

// Fill
ctx.fill();
}
}

window.onload = draw;

And this is where we are at:

Separate the slices

The last step consists of creating space in between the pie slices.

For each slice, the center has to be offset by (cos(mediumAngle) * offset, sin(mediumAngle) * offset) where:

  • mediumAngle is the angle formed by the origin and the slice bisector
  • offset is the base offset

All that is left to do is to implement that change:

function draw() {
var canvas = document.getElementById("canvas");
var ctx = canvas.getContext("2d");

var colors = ['#4CAF50', '#00BCD4', '#E91E63', '#FFC107', '#9E9E9E', '#CDDC39', '#18FFFF', '#F44336', '#FFF59D', '#6D4C41'];
var angles = [Math.PI * 0.3, Math.PI * 0.7, Math.PI * 0.2, Math.PI * 0.4, Math.PI * 0.4];

// Base offset distance of 10
var offset = 10;
var beginAngle = 0;
var endAngle = 0;

// Used to calculate the X and Y offset
var offsetX, offsetY, medianAngle;

for(var i = 0; i < angles.length; i = i + 1) {
beginAngle = endAngle;
endAngle = endAngle + angles[i];

// The medium angle is the average of two consecutive angles
medianAngle = (endAngle + beginAngle) / 2;

// X and Y calculations
offsetX = Math.cos(medianAngle) * offset;
offsetY = Math.sin(medianAngle) * offset;

ctx.beginPath();
ctx.fillStyle = colors[i % colors.length];

// Adding the offsetX and offsetY to the center of the arc
ctx.moveTo(200 + offsetX, 200 + offsetY);
ctx.arc(200 + offsetX, 200 + offsetY, 120, beginAngle, endAngle);
ctx.lineTo(200 + offsetX, 200 + offsetY);
ctx.stroke();
ctx.fill();
}
}

window.onload = draw;

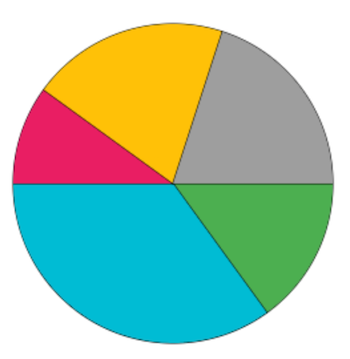
And this is the final result:

See the Pen Pie Chart Canvas HTML5 by Jonathan klughertz (@klugjo) on CodePen.

Hope you have enjoyed this. Leave your questions in the comments below.